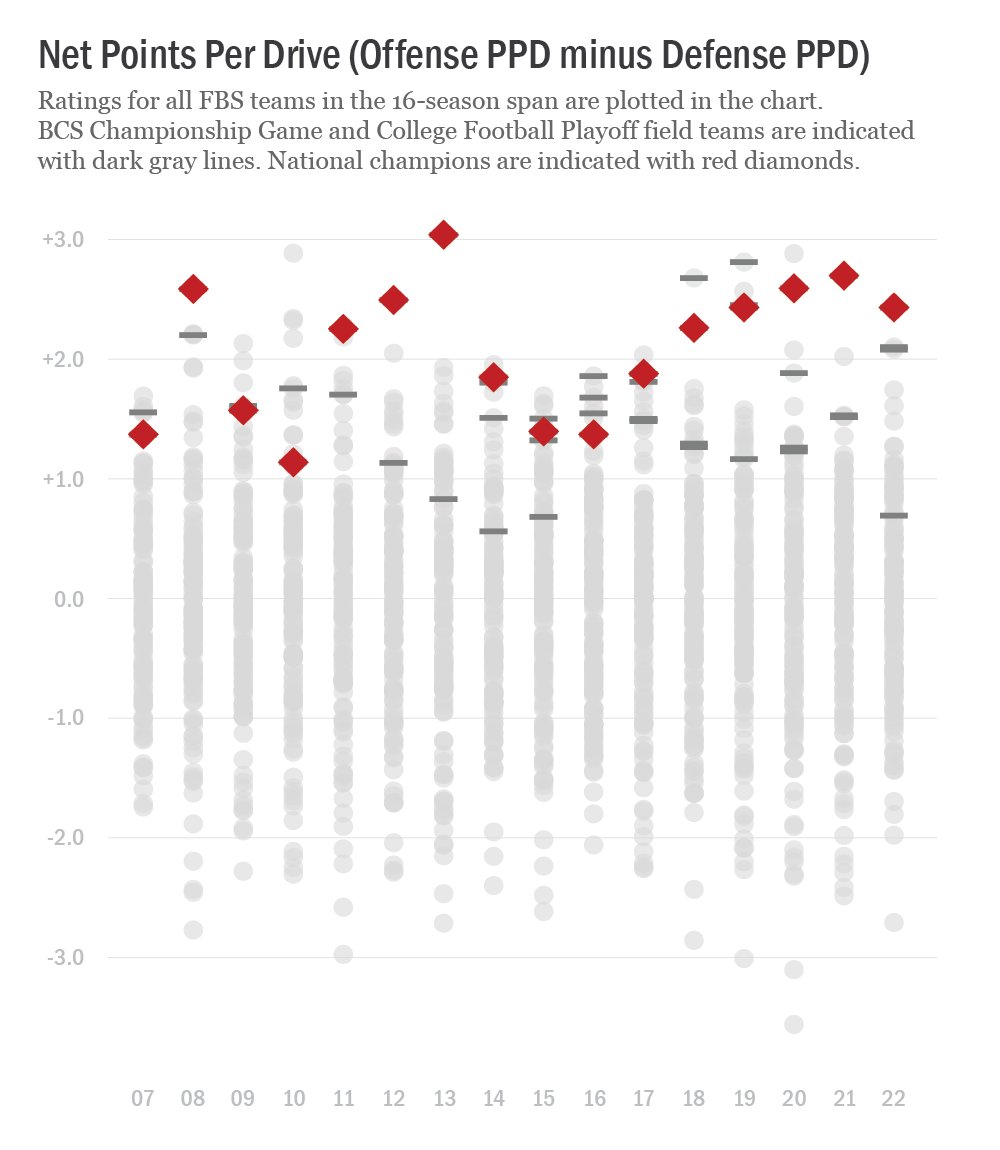
We are on a five year streak (and 9 of the last 15 years) in which the national champion finished the season with a net points per drive rating of at least +2.0. (Scoring two more points per drive than the opponent equates to an average margin of victory of ~24 points per game). (Stolen from Twitter)
I came up with the super sophisticated stat for determining how good a qb is. I call it the WAJB score (wah jab). It stands for “wins above Jake Bentley”. Basically if Jake Bentley was the qb instead of the qb we are measuring how many more or less wins would they have? Charlie Brewer was -.5 WAJB score and Cam Risinig has a 8+ WAJB.
Wow! By what parameters do you assess and calculate? Actually, don’t say it here, but I hope you have precise notes and an angle on publication or trademark protection.
Might be onto something.
Looking at our defense, I’ve always wondered just how many QB’s we have mentally wrecked over the years. I can think of several who are probably still hearing footsteps or looking over their shoulders expecting to get hit. That’s a stat worth knowing.